The Zone System and the Nikon D700
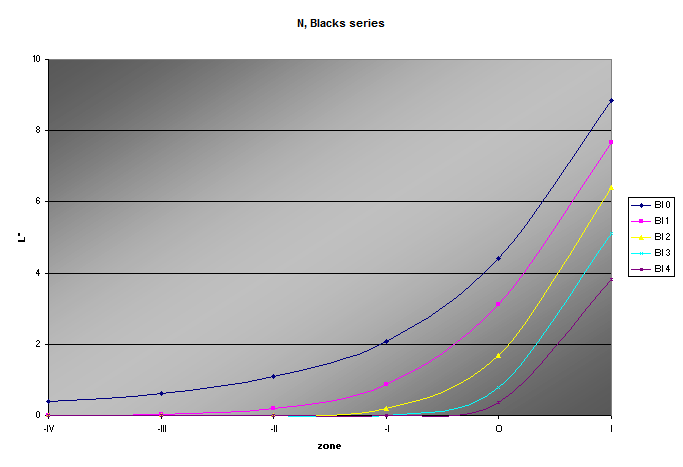
Let us begin with the basic exposure-response curve of the Nikon D700, ISO 200, 14-bit RAW capture, Adobe Camera Raw controls zeroed as previously described:
It is easy to see where the highlights blow to white, but the shadows taper off gradually. Let us zoom in for a closer look:
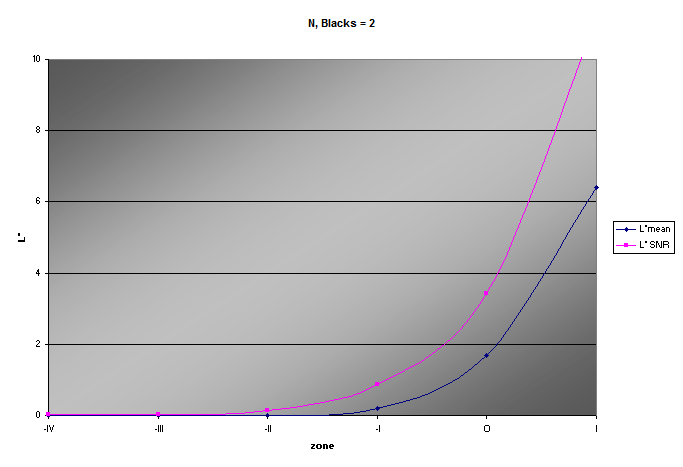
Our chosen threshold shadow value of 2 occurs at zone -I; but are these “good” shadows? First, let us check the signal-to-noise ratio:
A SNR of 4 is good in the shadows, as we saw on the previous page. But as we saw in the associated zone ruler, the shadow contrast here is not too good. Raising the Blacks slider sets the black point higher, which increases the slope of the curve, and therefore the contrast, in the shadows, with a neglible effect on the highlights:
Zooming in:
Using Blacks = 2, a threshold shadow value of 2 occurs a little above zone O, and the shadow contrast is better, as the next zone down is closer to zero. The SNR value at the threshold is still good:
Can we extend the shadows down further? We certainly can, by raising the Exposure value. This moves the whole curve in either direction:
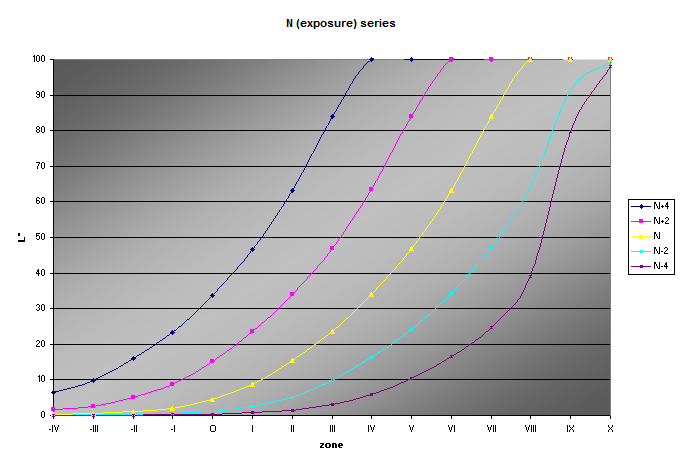
(The strange shape of N-4 is an artifact of how Excel drew the curve; you can imagine freehanding a curve through the points which corresponds to the others.)
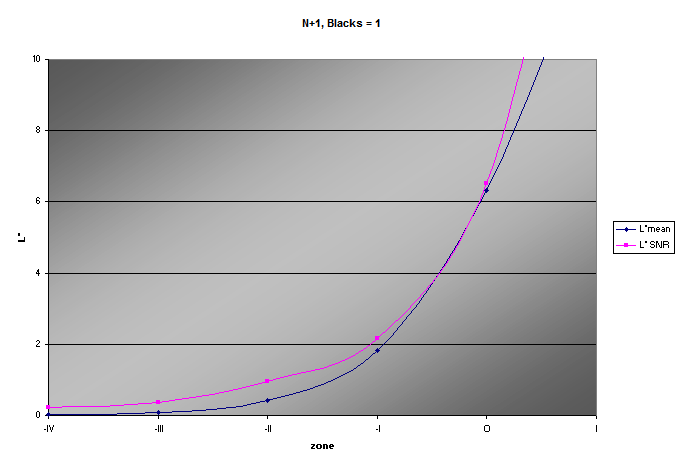
Let us look at N+1 (Exposure = +1), varying the Blacks slider as we did above:
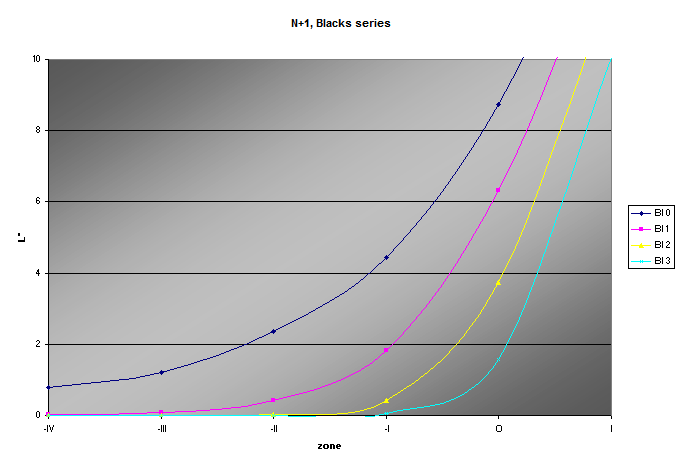
At Blacks = 1, zone -I has a good threshold value and good contrast. But the SNR is poor:
Moving Blacks back down to 0 doesn’t help:
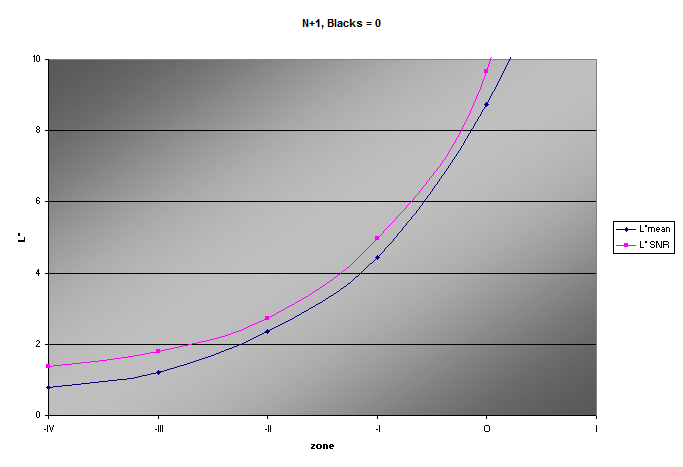
So it looks like good shadows go down to either zone -I, or a little above zone O if greater contrast is desired, using Exposure = 0 and Blacks from 0 to 2.
What about the highlights? Moving the Exposure slider moves the white point, and thus sets the highlight threshold. Here are curves made from the fractional zone interval exposures mentioned earlier:
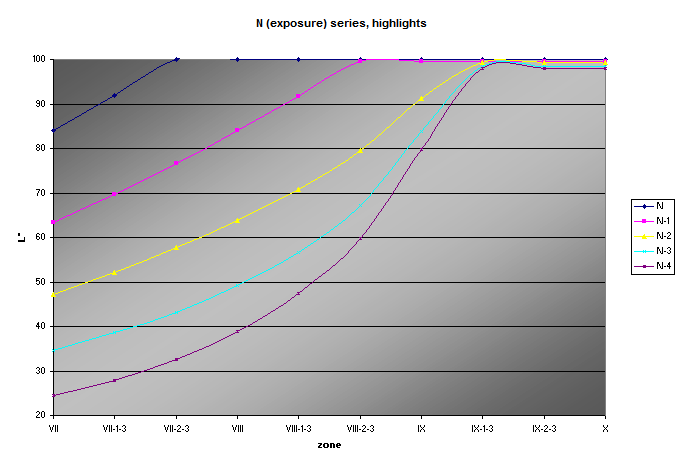
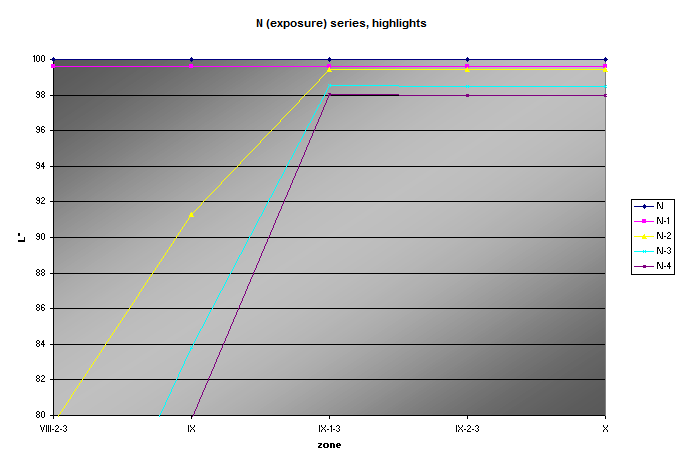
The high ends of the curves look odd because Excel’s math puts a little hump in them when they hit the top. Zooming in, and using straight lines rather than smooth curves, shows that the upper limit here is zone IX, and N-2 reveals just about all the available detail. Also note that the highlight output level is progressively reduced at higher exposure levels:
So, here are the three zone rulers made using the parameters determined above: N with Blacks = 0, N with Blacks = 2, and N-2. Good-quality print detail extends from zones -I to IX, a dynamic range of 10 stops:

|
||||||||||||

|
||||||||||||

|
||||||||||||
| -II | -I | O | I | II | III | IV | V | VI | VII | VIII | IX | X |
Next: the Leaf Aptus-II 5