Beyond the Digital Zone System—Examples
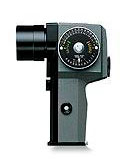
Now that we know the tonal range of our system, how do we use this information to make exposures? Either use your camera’s spot metering function and count on your fingers to keep track of the zone placements, or dust off that old relic of the darkroom days. I compared my Pentax V with the uncorrected meter reading of the camera at ISO 80, and the equivalent speed is 50.
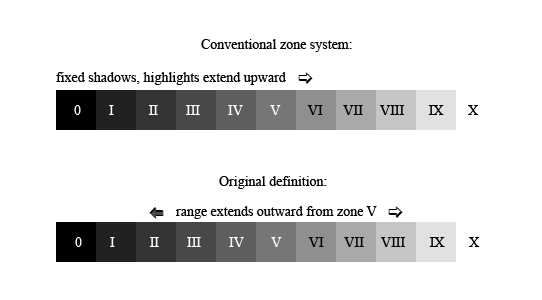
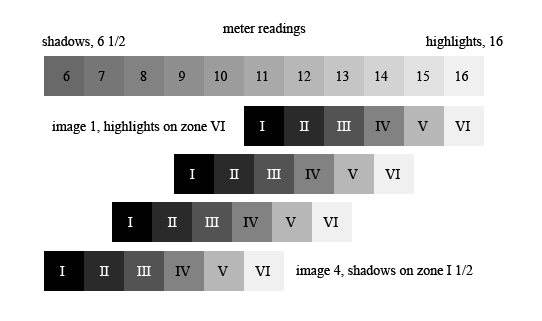
There are several ways to go about this. One could use a working ISO that places fully detailed shadows on zone III, or textured highlights on zone VIII, the way the film zone system works. (For me that would be ISO 200 for the camera, 125 for the Pentax.) However, in film photography, one end or the other of the tonal range (shadows for negatives, highlights for transparencies) is relatively fixed, and processing mostly affects the other end. By contrast, in digital imaging, especially when processing RAW images, both ends of the range may be manipulated by two full stops or more, and simple rules such as “textured highlights on zone VIII” do not translate very well. I have therefore referred back to the original definition of zone system placements,1 which begins with zone V, or the meter reading; the other zones extend outward from that central point. For my camera and workflow, I consider the textured shadows to fall on zone 0 and highlights on zone VII, the range that I have empirically determined, with extensions possible in each direction.
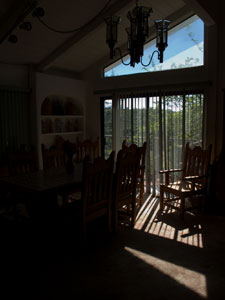
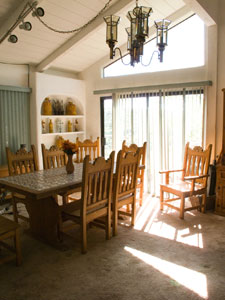
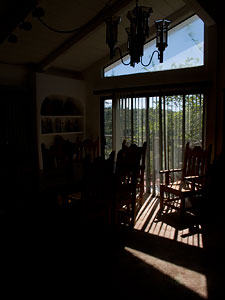
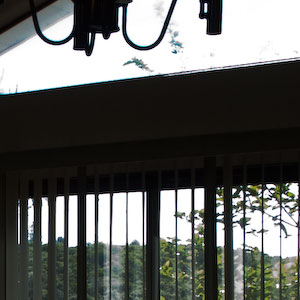
In the high-contrast scene below, the outdoor sky above the hilltops read 16 on the Pentax; I wanted this to have plenty of detail, as well as color saturation, so I placed it on zone VI. The three small dark vases on the shelf, and the dark leaves in the vase on the table, read 6 1/2; I wanted to place them on zone I. To cover this range, I took four exposures at f/8 from 1/250 to 1/8 sec in 1 2/3-stop intervals.
 |  |
 | 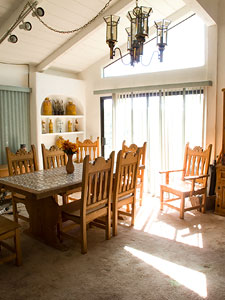 |
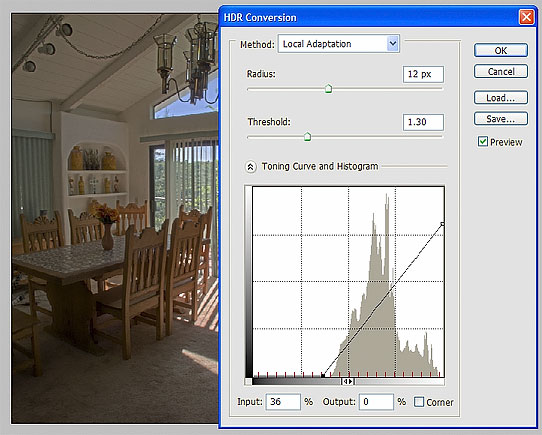
The full range of the scene as I visualized it is captured in these exposures; but as no single conventional image can hold it all, I combined them into an HDR image. I chose the conversion method Local Adaptation and set the endpoints to define the tonal range that I had visualized.
 |
After a few adjustments, here is the final result.
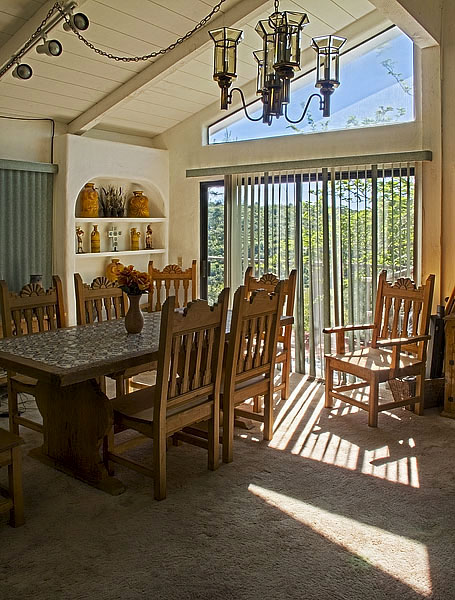 |
This is about how I visualized the scene in my mind’s eye.
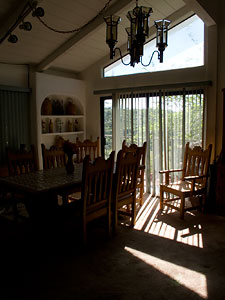
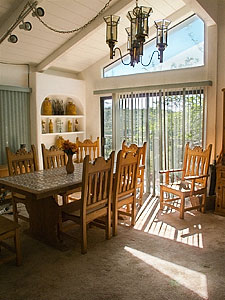
What if I had only one exposure of this scene to work with? In the second exposure above, the lower part of the sky, which was intended to be on zone VII, has been moved up 1 2/3 stops, to zone VIII 2/3. The leaves in the vase, originally on zone I, have been moved down twice as far, 3 1/3 stops, to zone -II 1/3. Based on the exposure-response curves, converting them with N-2 and N+2.5, respectively, reveals that the highlights retain a tiny bit of detail, but no saturation; and the shadows are starting to get noisy.

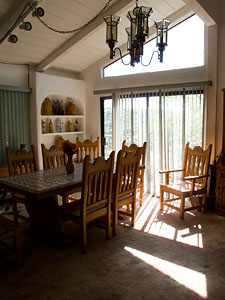
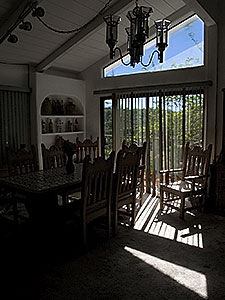
In the third exposure above, the sky has been moved up 3 1/3 stops, to zone X 1/3; the leaves have only been moved down 1 2/3 stops, to zone -0 2/3. Looking again at the exposure-response curves, converting them with N-4 and N+1, respectively, reveals that the highlights have blown, but the shadows look pretty good.

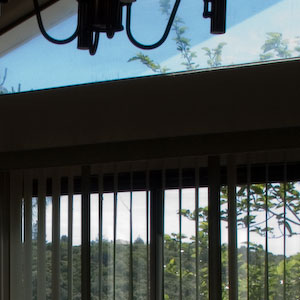
To illustrate the results of manipulating a single exposure, I chose the second one and processed it twice, at N-2 and N+2.5. Then I used layer masks to paint the window area of the dark one onto the light one, and made several other adjustments. The result is better than either of the originals; but some of the blue sky has been lost.
|
 |
Of course (and this is the whole point of the zone system), the appearance of the final image depends on visualization. I visualized the values in the scene fairly conventionally, having a luminous interior while preserving the view out the window, seeking a result that was not a very great departure from reality. But there are many ways to visualize any scene; someone who visualized a dark interior and a vivid outdoor scene would have made different zone placements and come up with entirely different results.
While taking these photos, at no time did I ever look at the image histogram, or even the preview image on the back of the camera in any detail (except to compose the picture). All I did was look at the scene, visualize how I wanted it to look, and made my zone placements. Using the histogram to determine the exposure is a handy shortcut which may give usable results in many situations; but to really pinpoint the values, calibrate your system and use a spot meter.
Now if I could only get used to that right-side-up image on the back of the camera . . . .