Another Fractal I Ching
This script generates hexagrams using the color data from fractal images of the Zaslavsky web map.
Click the canvas below to draw the image. You can also drag the mouse while holding the button down, but your computer’s speed may limit the results. The image is generated using the mouse coordinates together with the system time, so it is unlikely to ever repeat. You can change the degree of symmetry in the image. When you get an image that you like, click get hexagram to read the image and generate the hexagram.
How it works
The coin method of generating hexagram lines is the equivalent of choosing one of 8 line possiblities in the ratio 1:3:3:1 for changing yin, yang, yin, and changing yang. Because a hexagram contains six lines, there are 86, or 262,144, possible ways of generating a base and transformed hexagram. These possibilities may be represented by six-digit octal (base-8) numbers from 000000 to 777777. Each digit in the number represents one hexagram line.
The RGB color values (0-255) of each pixel in the fractal image are added together (typically between 1 and 3 million for the 200-pixel canvas). Think of it as measuring the amount of “paint” on the canvas. This number mod 262,144 is converted to base 8, and the digits converted to line numbers according to the table on the right.
The Zaslavsky web map is an iteration of the following:
x1 = (x0 + K sin(y0)) cos(α) + y0 sin(α)
y1 = −(x0 + K sin(y0)) sin(α) + y0 cos(α)
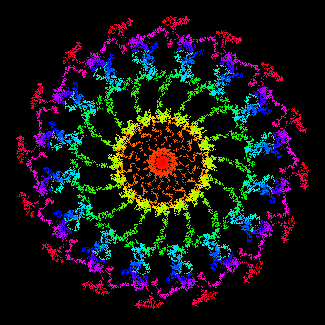
where α = 2π/q and q is an integer greater than 3; this determines the degree of symmetry in the figure and is chosen by the user above. (1 and 2 are simulated by showing only 1 or 2 sides of the 4-sided figure.) Here, K is the canvas width; it should be greater than about 4 to keep the image from appearing tessellated. x and y are based on the mouse coordinates, with the system time added to the mantissa so that the equations never repeat. There are no random numbers involved. Larger x and y values tend to result in an image that is more open in the middle. The number of points generated also affects the image; it grows as points are added, and is scaled to the canvas. 0.3 × the number of pixels in the canvas gives about the right point density. The points are colored with an RGB-CMY rainbow color palette in the order in which they are generated: red, yellow, green, cyan, blue, magenta, and back to red. For more information, see What makes an image a fractal?
The method described on a previous page, The Fractal I Ching, constructs hexagrams using a fractal-like pattern of lines, with mixed results. The method on this page is simpler and more reliable; it gives an appropriate distribution of hexagrams in response to user input, and is suitable for general use.
The line ratio after 1,000,000 iterations: 0.99974267, 3.00017733, 2.99905867, 1.00102133.
Hexagram distribution: mean 15625, s.d. 147 (0.94%), range 15283-15943.
Should work in all modern browsers (IE9+).
Download this page as a single file.