An Introduction to Photo Editing with PhotoLine: Hue/Saturation
Hue/Saturation layers
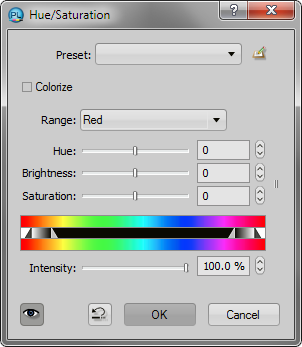
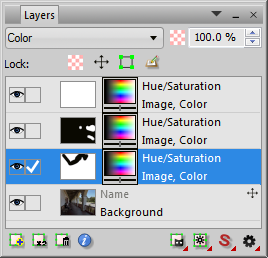
I tend to save saturation adjustments for last. In PhotoLine, curves may be used for this as well, specifically the S channels of HIS and HSV, and the a and b channels of Lab. But the simplest way, and still very effective, is to use Hue/Saturation adjustment layers, so let’s start there. Create one via Layer – New Adjustment Layer – Hue/Saturation, and set the blend mode to Color in the Layers panel. Note the three sliders. Hue is occasionally useful, such as when the colors of foliage or the sky could be improved. The Brightness slider is not nearly as effective as L curves and I do not use it for normal image editing. For me, this adjustment’s reason for existence is saturation.
Six hue ranges may be adjusted; I tend to adjust each one separately to take full advantage of them. Custom hue ranges may be defined if needed by moving the hue range sliders. The slider arrows are split to produce smooth transitions. Note that the members of the pairs may be moved together by clicking and dragging the gray gradient space between them, and all four may be moved as a unit by clicking and dragging the white space between the pairs. Note also that the red range wraps around the ends.
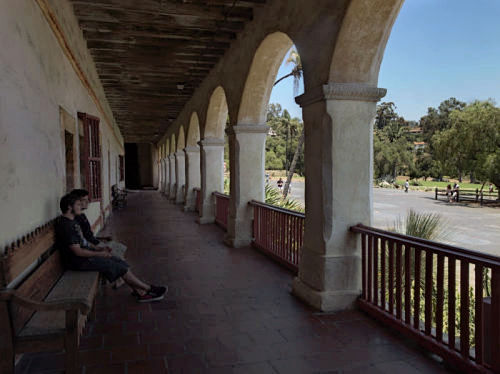
For this image, I started with red. A significant increase made the foreground more vivid; the upper masonry just needed to be masked. Next I increased yellow for the foliage (which in RGB is mostly yellow, not green). Increasing the blue saturation helped the sky, and had very little effect elsewhere so I didn’t bother masking it.
|
Roll your mouse over the image below to see the before and after.

|
 |
Saturation curves
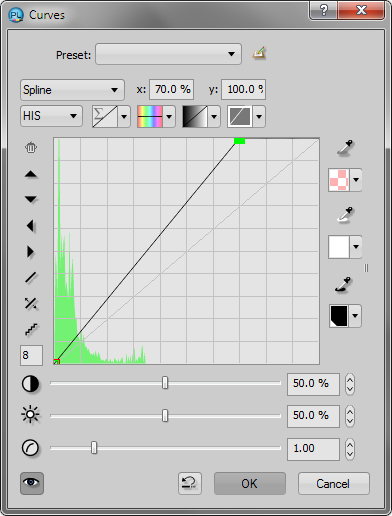
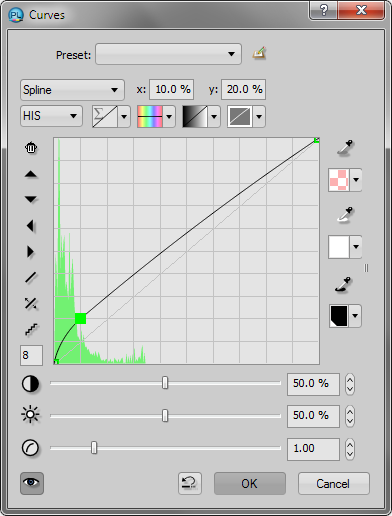
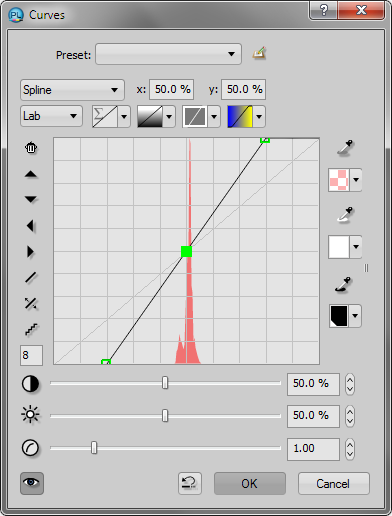
Curves are a more powerful, but more complicated, way to adjust saturation. They may also be used to adjust what is sometimes called “vibrance,” meaning that the saturation of less-saturated colors is preferentially increased. The saturation channel of the HIS (Hue, Intensity, Saturation) curve is probably the most useful for this. Start by creating a curves adjustment layer, and set the blend mode to Color. Change the mode to HIS, and select the Saturation channel (the fourth icon, with the red-to-white gradient). Take hold of the endpoint at the upper right and move it to the left, increasing the slope of the curve. This is a straightforward saturation increase. To increase vibrance, raise a point near the origin of the curve (raising the origin itself tends to produce unpleasant color artifacts). The shape of the curve may be adjusted as needed. One way to approach things is to increase the overall slope until an appropriate maximum saturation is reached, then to increase a point lower down to “fill in” the less-saturated colors. The curve may be lowered as well, such as to make a highly-saturated object pop out from its surroundings.
 |
 |
Color filters
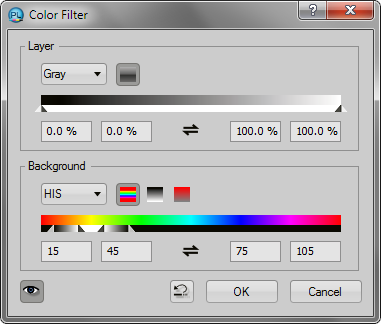
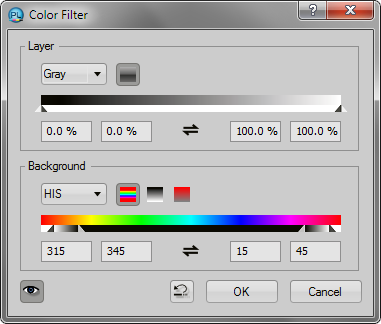
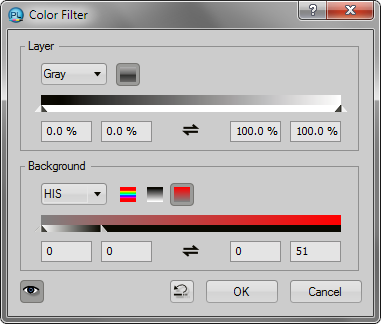
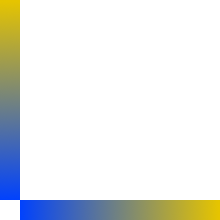
Color ranges may be specified for saturation curves as they are for the Hue/Saturation control, by applying a color filter. This is probably the most powerful way to adjust saturation. Right-click the layer in the Layer panel and choose Color Filter, or use Layer – Display – Color Filter. Change the Background mode to HIS and use the default Hue channel (the rainbow icon). Change the units in the number fields if necessary by right-clicking one of them and selecting Byte. Now adjust the sliders to create a custom Hue range. The sliders may be split and moved together as described above. Additionally, the Color Filter dialog may be stretched horizontally, making precise adjustments easier. New in version 21, you can also enter or change values in the number fields with the keyboard, mouse wheel, or arrow keys. A typical red range is 315-345 on one end, and 15-45 on the other. Wrapping the sliders around the ends is a little tricky; one way to do it is to set a yellow range of 15-45 and 75-105 first, then slide the whole thing down until the first slider is at 315. Or slide up to any other color range. (The relationships between the numbers sometimes vary a little, probably due to pixel position rounding errors; this is not significant.) You may move, widen, or narrow the range and/or the transitions to your heart’s content. The double arrows between the number fields invert the range. Cranking up the saturation to an extreme level helps you see the range you are selecting.
 |
 |
Side note: “luminosity masks” are a hot topic on the internet at present. Using a color filter/blend range in Gray mode can produce identical results, and is much simpler.
Another side note: a vibrance effect may be obtained by applying a saturation filter to a conventional Hue/Saturation layer. Create such a layer, and apply a generous amount of saturation. Then apply a color filter, but this time select the Saturation channel (the red-to-gray icon). Start by moving the upper slider down to zero; then gradually raise the upper white slider so that the saturation adjustment is preferentially applied to areas of low saturation.
 |
Lab Curves
The Lab (pronounced L-a-b, like R-G-B or C-M-Y-K) color space is powerful but not very intuitive. A full explanation is beyond our scope; see the Wikipedia Article, or Photoshop LAB Color: The Canyon Conundrum and Other Adventures in the Most Powerful Colorspace by Dan Margulis. In brief, Lab includes an L (Lightness) channel and two opponent-color channels. The a channel represents the green-red axis, and the b channel the blue-yellow axis. To increase saturation or vibrance, increase the slopes of the a and b channels. But in this case, the midpoint of each curve represents gray, and it must remain fixed unless color balance adjustments are desired as well. Start by creating a curves adjustment layer. Set the mode to Lab and choose the a (green-red) channel. Play with it to see what it does; raising it increases red (actually a magenta-red), lowering it increases green (actually a cyan-green). Now place a point at the midpoint (50,50). Move the origin and the endpoint around; the low end affects colors with a predominantly green component, and the high end similarly for a red component. It helps to visualize a green-red gradient along both the x and y axes, with gray in the middle. The b curve behaves similarly, but applies to blue and yellow. Points may be added for finer adjustments; to increase the blue of the sky, for example, click a pixel in the sky to place a point on the b curve, then lower the point.
Lab curve adjustments have a different character from the saturation adjustments described above, because adjusting the a and b curves changes the hue as well as saturation. This may be useful for separating closely-spaced colors such as the greens of mixed foliage.
To make color balance adjustments as we did with RGB curves, raise or lower the midpoints of the a and b curves. To warm the image, for example, start by raising the b curve, then fine-tune the hue by raising the a curve. To cool the image, lower the curves in the same manner. Lab is a good way to correct skin tones in old, faded photos; click an area of skin on the a and b curves, then adjust them until the hue and saturation look right.
Use Normal blend mode for Lab adjustments. Color blend mode should be used for RGB hue adjustments, Hue/Saturation layers, and HIS saturation curves.
 |
 |
 |
Actions
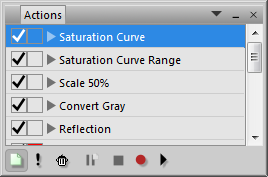
Creating a custom saturation curve is so complex that it is best to record it as an action (sometimes called a “macro”). Open the Actions panel (undock it if necessary). Click the New Action (file) icon and give the action a name, such as Saturation Curve. New actions are added to the bottom of the list; you may drag yours to the top for convenience. Now click the red Start recording button. Everything you do will be recorded until you click the Stop recording button. To run the action, press the Play active action button; then adjust the resulting curve and the color filter range. I have recorded some sample actions for creating a global saturation curve, a curve with a range, and an Lab curve. To load them, right-click the Actions list and select Merge. To export an action that you created, select Save Active. (It is wise to keep backups of your actions because they are easy to accidentally overwrite or delete.)
 |
The brush editor, Lab and saturation curves, and color filters are what I consider PhotoLine’s strong points; they are superior to comparable tools in other photo editors, and allow more control over the final result.