Beyond the Digital Zone System
How much dynamic range do I actually get with my digital camera? How much more can I get by processing the RAW image? Where do I place the highlights so they don’t blow? If I am bracketing to cover a high dynamic range, how will I know I am getting the entire range?
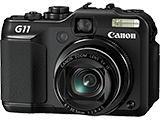
Armed with nothing more than my humble Canon G11, the Adobe DNG Converter, Adobe Camera Raw, and Photoshop CS2, I set out to find out. I took some pilot shots one late Friday afternoon, played around with them that evening and made a definitive plan. The next morning I made 63 exposures, using several targets (backlit white curtains, a white stucco interior wall, and a white shirt in a dark hallway) and three ISO speeds. I spent the rest of the day analyzing the results and making exposure-response curves in Excel.
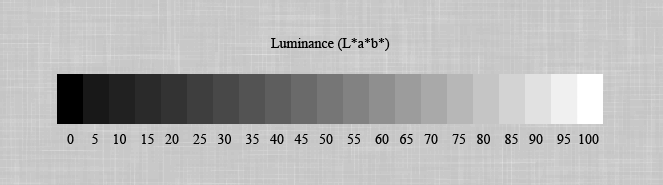
My goal was to determine the full dynamic range attainable in the RAW image of my camera, and create exposure-response curves for different settings of the Exposure and Shadows (white and black point) controls of Adobe Camera Raw. For exposure, I used the zone placement, with the uncorrected exposure indicated by the camera’s spot meter as zone V. Response was the luminance of the processed (non-RAW) image, measured as L* of the L*a*b* color space.
I then used this information to come up with an application of the zone system which is based on the unique features of digital imaging, and not simply transposed from film photography. In doing so, I followed the example of Ansel Adams in his adaptation of the zone system to polaroid and reversal film; more about this in the general approach section.
|
|
|||||
| L* = 2, 5, 95, 98 | ||||||
Workflow: .CR2 (RAW) images taken with the Canon G11; converted with Adobe DNG converter; processed with Adobe Camera Raw using a range of Exposure values, and Shadows set at either 5 (default) or 0; processed .tif images measured for luminance in Photoshop.
The following assumes a basic understanding of the zone system. If you need more of an introduction, see the zone system page. It also assumes that you have a properly-calibrated monitor; I can see detail in all four of the L* value images above.
| Next: the results | 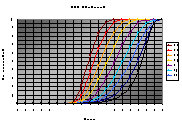 |